Open a terminal, go to the Desktop directory and unzip the downloaded file:
cd ~/Desktop or cd ~/Downloadsls -lhrt *zip
unzip beta-strand.zip
Have a look at the structure using pymol (or alternatively with VMD):
pymol pr.gro
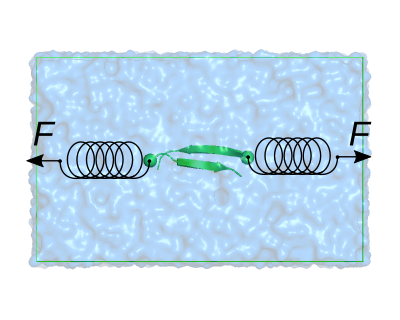
You will see the two beta strands immersed in water and a neutralizing ion. Highlight the CA atoms of the N-termini by typing in the pymol console
  show spheres, name CA & resi 1+9
  color red, name CA & resi 1
  color blue, name CA & resi 9
We will pull the red- and blue-shown CA atoms away from each other. To attain this, we need to use the Center Of Mass (COM) pulling module of GROMACS. In the linux terminal, after closing pymol, open the mdp file used for the equilibration using the text editor of your preference (e.g. gedit):
gedit run.mdp
Now append the following options regarding COM pulling at the end of the mdp file. After that, save and close the mdp file.
; COM PULLING
pull                     = yes
pull-nstxout             = 50
pull-nstfout             = 50
; Number of pull groups
pull-ngroups             = 2
; Number of pull coordinates
pull-ncoords             = 2
; Group and coordinate parameters
pull-group1-name         = r_1_&_CA
pull-group2-name         = r_9_&_CA

pull-coord1-type         = umbrella
pull-coord1-geometry     = direction
pull-coord1-groups       = 0 1
pull-coord1-dim          = Y N N
pull-coord1-origin       = 4.0 2.5 2.5
pull-coord1-vec          = 1.0 0.0 0.0
pull-coord1-start        = yes
pull-coord1-rate         = -0.5
pull-coord1-k            = 1000

pull-coord2-type         = umbrella
pull-coord2-geometry     = direction
pull-coord2-groups       = 0 2
pull-coord2-dim          = Y N N
pull-coord2-origin       = 4.0 2.5 2.5
pull-coord2-vec          = 1.0 0.0 0.0
pull-coord2-start        = yes
pull-coord2-rate         = 0.5
pull-coord2-k            = 1000
These options will tell GROMACS to turn on the COM pulling module, to pull the CA atom of residue 1 (pull group1: r_1_&_CA) and that of residue 9 (pull group2: r_9_&_CA), using two coordinates (pull ncoords: 2), one for each atom (pull-coord1-xxx and pull-coord2-xxx options separately for each coordinate). A harmonic force (pull type: umbrella), along the x direction (pull geometry: direction, pull dim: Y N N , and pull vec: 1.0 0.0 0.0) is used. The harmonic springs move at a rate of 0.5 nm/ps (pull rate: +-0.5) and have an elastic constant of 1000 kJ/mol/nm2 (pull k: 1000).
Now let us create an index file containing the groups to be pulled:
  {
  echo r 1 \& a CA
  echo r 9 \& a CA
  echo q
  } | gmx make_ndx -f pr.gro
Then, generate the tpr file by typing:
gmx grompp -f run.mdp -c pr.gro -p topol.top -n index.ndx -maxwarn 1 -o pull.tpr
Finally, run the pulling simulation:
gmx mdrun -s pull.tpr -v
This simulation runs for 9 ps and should take few minutes depending of your workstation. Once the simulation ends, have a look at the generated files:
ls -lhrt
Let us first visualize the trajectory with pymol. Load the starting conformation:
pymol pr.gro
and then load the trajectory on it, by typing in the pymol console:
load traj_comp.xtc, pr
Hide the water molecules and display protein as sticks:
    hide
    show cell
    show sticks, poly
Play around with the visualization, orientation, and frame rate to get a visual idea of the pulling process.
Question: What can you say about the detachment of the two beta-strands? which interactions are disrupted?
From visual inspection it is hard to identify which interactions were disrupted. Let us calculate the number of hydrogen bonds of the main chain:
gmx hbond -s pull.tpr -f traj_comp.xtc -num
select "MainChain+H" group twice. Plot the number of hydrogen bonds:
xmgrace hbnum.xvg
Question: what happens with the hydrogen bonds when pulling?
The force exerted on the two pulled groups is stored in the pullf.xvg file. Plot this graph with xmgrace, after closing pymol:
xmgrace -nxy pullf.xvg
Question: Why do you think the two forces are almost equal in magnitude but of opposite sign?
Question: what is the rupture force? what happens with the hydrogen bonds at the moment of rupture?
Pulling at a smaller pulling velocity
Now, repeat the simulation, but this time with a pulling velocity 10 times smaller. Note that the length of the simulation has to increase by 10-fold. Make the following changes in the run.mdp file:
   nsteps                   = 45000
   pull-coord1-rate         = -0.05
   pull-coord2-rate         = 0.05
Create the new tpr with grompp:
gmx grompp -f run.mdp -c pr.gro -p topol.top -n index.ndx -maxwarn 1 -o pull_slow.tpr
and run the simulation, setting the default name of all output files to "pull_slow":
gmx mdrun -deffnm pull_slow -px pullx_slow.xvg -pf pullf_slow.xvg -v
The simulation may stop before completing the 45000 steps if any of the two pulled groups moves a distance larger than half of the simulation box size. This may be an indication that the two strands dissociated. Have a visual look if that is indeed the case (e.g. with vmd):
vmd pr.gro pull_slow.xtc
Now compare the force profiles:
xmgrace -block pullf.xvg -bxy 1:2 -bxy 1:3 -block pullf_slow.xvg -bxy 1:2 -bxy 1:3
Black and red curves correspond to the original pull velocity (0.5 nm/ps) and green and blue to the slower velocity (0.05 nm/ps).
Question: What is the rupture force for this new pulling velocity?
Question: What do you think it will happen if the pulling velocity is reduced further, e.g. 10 times slower?
Question: which rupture force do you think is more reliable?
Pulling in another direction
Now, repeat the pulling simulation, choosing as second pulling group (the CA atom of residue 17 instead of residue 9) and pulling along the z-axis. To this end, update the following lines in the run.mdp file, according to:
    pull-group2-name         = r_17_&_CA
    pull-coord1-dim          = N N Y
    pull-coord2-dim          = N N Y
    pull-coord1-vec          = 0.0 0.0 1.0
    pull-coord2-vec          = 0.0 0.0 1.0
Also, update the new pull groups in the index file
  {
  echo r 1 \& a CA
  echo r 17 \& a CA
  echo q
  } | gmx make_ndx -f pr.gro
Create the new tpr with grompp:
gmx grompp -f run.mdp -c pr.gro -p topol.top -n index.ndx -maxwarn 1 -o pull_r17.tpr
and run the simulation, setting the default name of all output files to "pull_r17":
gmx mdrun -deffnm pull_r17 -px pullx_r17.xvg -pf pullf_r17.xvg -v
Question: how would you describe the dissociation in this case (pulling along the z-axis) compared to the previous situation (pulling along the x-axis)?
Question: How do the rupture forces compare in these two cases?
Question: which conclusions can you draw from these simulations regarding the force-response of beta-sheets and the direction of force application ?
B. Optional exercises
Optional exercises:
pull-coord1-type         = constant-force
pull-coord1-rate         = 0
pull-coord1-k            = 1000 ; the applied force will be minus this value

pull-coord2-type         = constant-force
pull-coord2-rate         = 0
pull-coord2-k            = -1000 ; the applied force will be minus this value
Here, you could try different forces and thereby monitor the force dependency of the rate of dissociation.